Today there was much consternation in the UK media about the results from a new report from The Institute of Economic Affairs about the reasons why pubs have been closing in the UK. For
example, and as usual for entertainment value, the Daily Mail open with: “Tax and red tape close 6,000 pubs over the past eight years: Drinks taxes in UK are so high they are responsible for 40% of entire EU alcohol duty” (link).
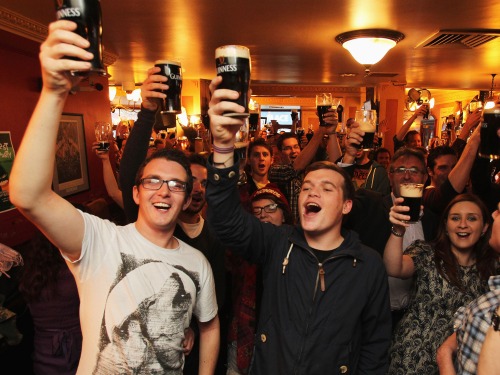
The number of pubs has indeed been falling, which is a shame…I kind of like them. More specifically, if it wasn’t for the UK pub I wouldn’t have come across the Great British Ale as an occasional, and tasteful substitute for the Great European Lager. So I, and with me many people, happen to like the British pubs; so it is a shame that they are closing.
 But why are they closing? According to the Institute of Economic Affairs in its new report Closing Time (link to pdf) it is to some extent because of cultural trends (4,000 pubs since 2006), but primarily because of taxation, regulation and the recent decline in disposable income; with especially the smoking ban and the alcohol duty escalator being identified as the culprits (6,000 pubs since 2006). This won’t come as a surprise to anyone familiar with any reports by the Institute of Economic Affairs (IEA), whose conclusions are always that anything is caused by taxation and regulation; regardless of the actual question. Similarly, the author of the report, Christopher Snowden, rarely comes to any other conclusions (nonetheless, his book “The Art of Suppression” is quite entertaining). These conclusions have been duly copy-pasted by the Daily Mail, who conveniently forgot to mention the 4,000 pubs apparently closed because of cultural trends and also put the fact that it is all due to the European Union in the title (although it is a minor comment in the actual IEA report). The main things to remember is that the closing of the British pub is not really caused by the recession, nor by the alcohol industry’s-public house “beer ties” (link). Well, having said that, there is an interesting BMJ series on links between the industry and the UK government, which also discusses financial ties between the industry and IEA (for example: link)….so that’s something to think about.
Anyway…
Similar to the Heartland Institute’s website, about whom I wrote last month (link1, link2), the IEA website also has a figure on its website “Who’s killing the British pub?” (link), clearly indicating that the number of pubs dropped rapidly from about 2007:
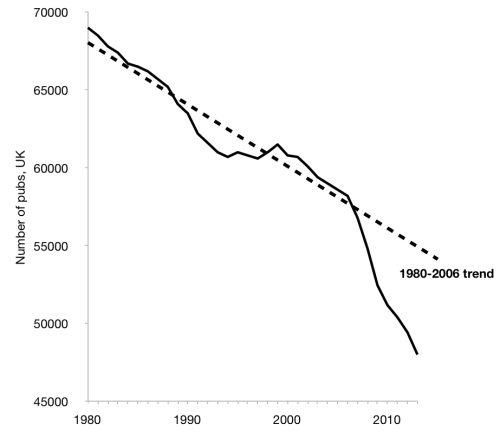
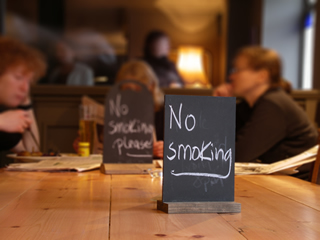
2007, you may remember, is the magical year the smoking ban (link) got introduced in the UK. So there you go…it’s that dreaded smoking ban!
Unfortunately, this time I could not obtain the data to redo the figure. It’s based on a dataset from the British Beer&Pub Association, and although they do have a statistics section with downloadable data, these specific data are not made available. What is made available are the total number of pubs in the UK for 5-year periods from 1982 up to 2013 (which can be found here)….although for unknown reason they have not provided the number for that dreadful year 2007, but instead for 2009 (so there is a 7-year gap) and then for each year onwards. So what I have done is used those numbers, which seem to be the same as in the IEA figure but are much less detailed because I do not have access to the annual data. What I have done further is to, instead of plotting the 1980-2006 trendline instead plotted the trend over all available data. If you also read the previous posts on climate change you will have seen what a carefully chosen “reference period” can do for the presentation of your data. So this is what you get if you do that:
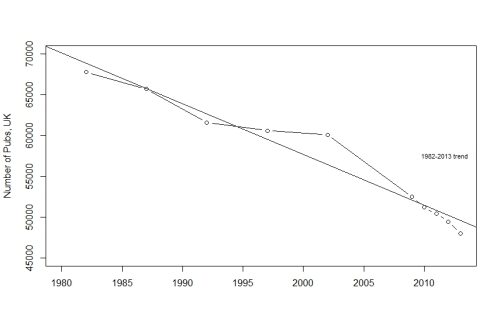
So interestingly…that looks slightly less exciting doesn’t it? Of course we can all agree that the number of pubs is declining, which is sad. But actually, it has been declining steadily since 1982 (by a little over 600 pubs annually) with only a single ‘odd point’; the 2002 estimate. It’s a pretty good model, with the steady, linear trendline explaining about 95% of the data. Unfortunately, I do not have more data to have a better look of natural variability, but even this figure shows that how IEU presented their data is intended to (and presumably works) to exaggerate the effect of “something happening in the vicinity of 2007, which may or may not be the introduction of the smoking ban”.
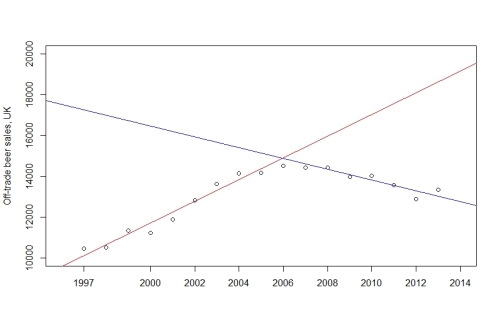
The British Beer&Pub Association website provides other data as well, which is quite interesting. They do for example provide the UK Quarterly Beer Barometer, which provides the total beer sales since 1997 for on-trade (pubs, clubs, bars restaurants, etc ) and off-trade sales (off licences, corner shops, supermarkets,etc). I have plotted these data for on-trade sales (in 1,000s of barrels!!), which is what we are interested in in relation to the pubs; and for convenience I have added a line at the year 2007:
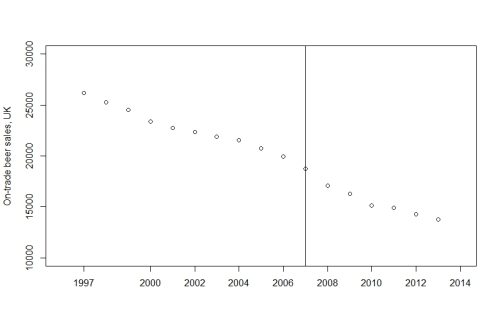
As you can see, that is again a pretty linear line (note, that I have removed 2014 because that only has data for 3 quarters). However, I am with you if you say there is the suggestion of a bit of a dive in 2007. That magical year again!
Similar to what was done in the IEA, I have now calculated and added the trendline for the data prior to 2007 (in red), but I have also added the trendline for years 2007 to 2013(in blue):
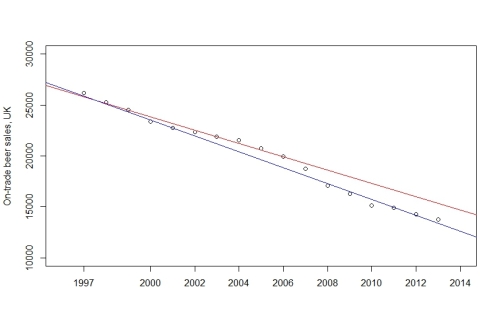
 In summary, pre-2007 the number of beers sold in the UK had been declining by about 650,000 units per year, but from 2007 onwards this decline appears to be steeper; around 780,000 per annually. We can officially test this difference and find a p-value of 0.09; depending on your point-of-view this is either non-significant or a borderline statistically significant difference. Regardless, with an average of let’s say 55,000 UK pubs that is about 2.4 barrel per pub per year difference. I think this corresponds to about 700 pints per year per pub, or, if we take the 2014 average price per pint (£3.23) that is about £2,200 per pub that may be the direct result of the 2007 event; maybe the smoking ban. Now I have no idea about profit margins for a pub in the UK, but I cannot imagine that, even if this was all caused by the introduction of the smoking ban (and that’s an if!), that this is very important compared to the natural, pre-2007 decline, which by itself equates to 11.8 barrels per pub per year (or about £11,000 per year); in fact it’s about 16%.
That is, if these figures are correct!
Let’s do something else. Let’s all agree that “something happened in 2007” ; something that pulls on the regression line regardless of whether you put it with the pre-period (so 1997-2007 and 2008-2013) or with the post period (so 1997-2006 and 2007-2013, as we did above). Let’s ignore that datapoint and calculate the same regression lines as we did above, but for 1997-2006 and 2008-2013:
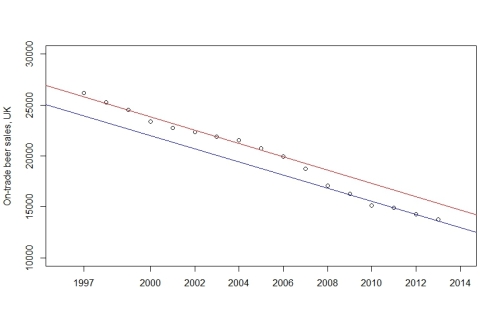
That looks pretty different now, doesn’t it? As a matter of fact, we are now comparing a decline of 653,000 barrels per year using the pre-2007 data with a decline of 644,000 barrels per year using the post-2007 data. The trends are now nearly identical (p-value~0.55). What that means is that since 1997 there has been an annual, “natural”, decline of on-trade beer sales that has been completely stable during the past 16 years….except for this single event in 2007, which may have been due to the smoking ban. Anyway, this “structural difference” is about 20,000 barrels per year. Which, using the same assumptions as above equates to about £345 per pub annually (or a maximum of just over £400 if we use an exceptionally low number of 45,000 pubs).
Do these figures mean that the smoking ban has contributed…yes they seem to (unless something else happened around that time I have missed). Does this mean that, and I quote from the IEA report, “The smoking ban…..are particularly culpable”…not really.
So was it those damn taxes? I don’t know a lot about these, but again The British Beer&Pub Association website has some data we can work with. They provide data on the price of a pint from 2002 to 2014, during which the price steadily rose from an average of £2.02 to £3.23, or about 60%. That in itself is probably a good reason for the decline in sales we observed above. But is it due to taxes? Those data are also provided on the website, and show that duty on a pint has increased from £0.28 to £0.45 (or 60%) and VAT from £0.30 to £0.54 (or 80%). Interestingly, if you divide total taxes by the total price of a pint, this has remained remarkably consistent (29%-31% in 12 years). So a little less than a third of your pint is taxes, and has been like that since at least 2002. So really, it isn’t taxes either since nothing much has changed for quite a while. The price of the pint itself (minus taxes) has increased by £0.80, which is about twice as much as taxes have increased (£0.41). So that seems much more of an issue in relation to declining sales of beer. Why that is, I don’t know nor have I looked into it…
The Daily Mail shouts that is due to red tape, so who knows. “Natural” trends seem more likely as our analyses above showed. Increased off-license sales and drinking at home have been blamed for the decline of the pub as well. There is probably some truth in that, and again The British Beer&Pub Association website provides some data. I did the exact same thing as I did above for on-license sales:
For fun I also added the trendlines before (red) and after(blue) the smoking ban to the plot, similar to the analyses above. Interestingly, off-trade sales have increased until 1997 by about 533.000 barrels per year until, for fun let’s say 2007, after which they have been declining by about 265.000 barrels per year. So will this have had something to do with the closure of the pubs? It most likely will have, but not after introduction of the smoking ban…..the situation in fact got better. In fact, if the British have been drinking the same amount of beer in total, then any effect from the smoking ban has been completely wiped out by a decline in off-trade sales!
All of us living in the UK could of course have made a massive step sideways to wine, spirits and other alcoholic drinks; that could explain it. Or maybe, and that may sound odd (especially to foreigners or those who base their understanding of the world on the Daily Mail), just maybe we have all become a bit smarter and started to drink less? Looking at other data from the BBPA for litres of alcohol consumed (instead of just beer) presented on the website of the Institute of Alcohol Studies (link) this may well be the case (shamefully copied):
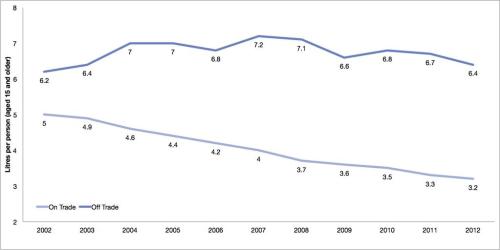
So we all drink less alcohol, that’s not a bad thing. I would even go as far as saying that is a healthy thing! By why do we do this? Is it the price of the alcohol, are we just getting smarter and do we drink less? There are probably other reasons…? Including those that would be funny if they weren’t so tragic: …according to the Tories it is all due to muslims (link)…
…but what does not seem to contribute too much to the decline of the British pub are the introduction of the smoking ban or taxes; despite what the Daily Mail may tell you.
****** updated 11/12/2014 ******
Thanks god for the blog, and for reader interaction. Christopher Snowden provided the missing numbers between 2002 and 2009 so we can look at the same figure. See it below, with the IEA trendline (with data up to 2006) in red, the trendline based on all data in black and the data using all data minus the 1997-2006 period (see comments below this article) in blue.

I think this is an interesting figure; all trendlines show a steady decline in the number or pubs, we can all agree on that. But whether one should believe the dramatic drop shown relative to the IEU trendline…using part of the data only, or my artificial trendline indicating something interesting in the early part of the 2000s….also using only part of the data, is anyone’s guess. I would advocate using all data without using arbitrary cutpoints (the black line), which indicates a surprisingly linear decline in the number of pubs in the previous 30 years. But regardless, it would be very interesting to know what reversed the decline for a couple of years in 1997-2006, and of course what will happen in the future…
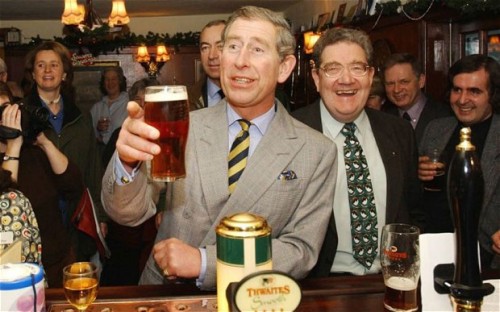
…I intend to help out whereever I can, and with Christmas dinner coming up it is time to visit the local pub now!

its not this one unfortunately….


 Sense about Science
Christopher Snowdon
December 11, 2014
Cool graph showing pub numbers there. It’s a shame who has the data for ALL the years hasn’t made one already so we can really see what happened between 2002 and 2009. 😉
LikeLike
FdV
December 11, 2014
Indeed…ideally it would be one for which the data were available so that one could draw some trendlines on it themselves :). Would look basically the same as the one I made though; the deviance during of the 1997-2006 period is quite interesting….
LikeLike
Christopher Snowdon
December 11, 2014
2002: 60100
2003: 59400
2004: 59000
2005: 58600
2006: 58200
2007: 56791
2008: 54818
Have fun.
LikeLike